Note
Click here to download the full example code
Neo All - example 4
In this example, we look at the single unit activity around interictal epileptic discharges (IEDs). To do this we will add events and define epochs to the NeoAll instance.
from neoStructures import *
import pandas as pd
import matplotlib.pyplot as plt
from os.path import isdir, join, isfile
import seaborn as sns
import pickle
sns.set()
sns.set_context('paper')
In this example we will load the NeoAll instance from a pickle file
data_dir = join('pySpikeAnalysis', 'sample_data') if isdir('pySpikeAnalysis') else join('..', '..', 'pySpikeAnalysis', 'sample_data')
neo_all_filename = r'neoall_071118_1132.p'
if not isfile(join(data_dir, neo_all_filename)):
    raise ValueError('Cannot find the file {}'.format(join(data_dir, neo_all_filename)))
with open(join(data_dir, neo_all_filename), 'rb') as f:
    neoAll = pickle.load(f)
See information about NeoAll :
print(neoAll)
Out:
NeoAll Instance with 19 units. 1 Neo segment per unit. Each segment contains 1 Neo spiketrain
17 channel indexes
49 channels and 49 electrodes
Before creating epochs, we first need to create events. They can represents stimuli onset or epileptic events for
instance. In this example, each event correponds to an Interictal Epileptic Discharge. There are two ways to create
events, either by providing the event_filepath parameter when instanciating a NeoAll instance or by calling the
neoStructures.NeoAll.read_event_file() method. The indexing of the csv file (i.e. to which field correspond each
column) is done in the neoStructures_params.py file.
Here we can see that the neoAll already contains events :
print(neoAll.segments[0].events)
Out:
[<Event: >]
We can access the times of the events and the name of the events :
print('Event name : {}'.format(neoAll.segments[0].events[0].name))
print('Event times : {}'.format(neoAll.segments[0].events[0].times))
Out:
Event name : Pointe
Event times : [ 127.59    132.4795  134.4737  149.087   230.2434  232.3191  270.5974
  441.8186  501.2786  617.0066  753.7445  770.4778  816.693   974.7162
  982.7807 1157.6631 1169.6899 1226.8002 1478.6519 1597.9215 1635.7244
 1904.1508 1912.3301 1937.7698 1963.7687 1998.6647 2029.0295 2105.2268
 2109.5313 2136.0479 2188.8211 2296.0886 2621.6179 2900.5309 3206.0556
 3321.9253 3387.3586 3627.9234 3790.2395 3927.836  4266.9786 4441.5314
 4585.17   4827.7493 5235.3367 5362.5499 5547.8424 5567.3848 5590.6934
 5674.0067 5791.6717] s
Let’s now define epochs on each segments (NeoAll class contains one Neo.segment for each unit), using the
neoStructures.NeoAll.create_epochs_around_events()
We have to specify the epoch onset and duration (s), as well as the epochs name.
epoch_t_start = np.array([-0.500, -0.250, -0.050, 0.050, 0.250])
epoch_duration = np.array([0.250, 0.200, 0.100, 0.200, 0.250])
epoch_names = ['Pre-IED baseline', 'Pre-IED', 'IED', 'Slow wave', 'Post-IED']
We must specify around which event we want to create epochs
neoAll.create_epochs_around_events('Pointe', time_offset=epoch_t_start, epoch_duration=epoch_duration,
                                   epoch_names=epoch_names)
We can now study the behaviour of neurons on the different periods of the IEDs we have defined.
neoAll.plot_spikerate_change_ratio_on_epochs('IED', 'Pre-IED')
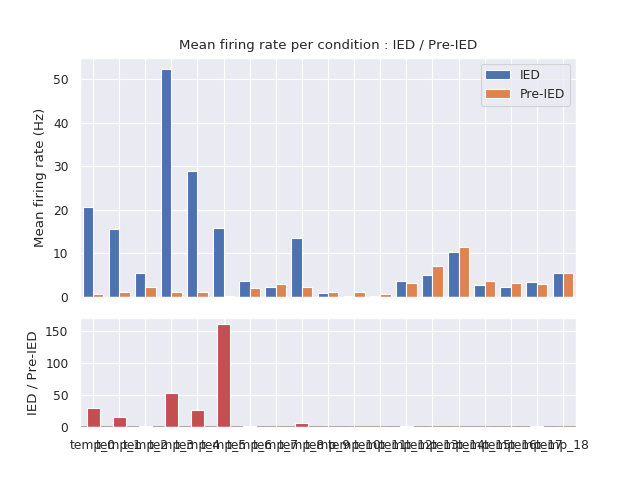
We can see that some units start firing during the IED and are almost silent before, in the Pre-IED period. Further analyses can be conducted using the NeoEpoch class which allows to plot rasterplot of the different units around the events of interest.
Total running time of the script: ( 0 minutes 0.523 seconds)