Note
Click here to download the full example code
Neo Epoch - example 1 - Rasterplots
This example shows how to use NeoEpoch
from neoStructures import *
import matplotlib.pyplot as plt
from os.path import isdir, join, isfile
import _pickle
import seaborn as sns
sns.set()
sns.set_context('paper')
Load neoEpoch data with _pickle
data_dir = join('pySpikeAnalysis', 'sample_data') if isdir('pySpikeAnalysis') else join('..', '..', 'pySpikeAnalysis', 'sample_data')
print(data_dir)
neo_epoch_filename = r'neoepoch_070119_1117.p'
if not isfile(join(data_dir, neo_epoch_filename)):
    raise ValueError('Cannot find the file {}'.format(join(data_dir, neo_epoch_filename)))
with open(join(data_dir, neo_epoch_filename), 'rb') as f:
    try:
        neo_epoch = _pickle.load(f)
    except:
        raise Exception('Cannot pickle the file {}'.format(join(data_dir, neo_epoch_filename)))

neo_epoch.save_fig = 0
Out:
../../pySpikeAnalysis/sample_data
See information about NeoAll
print(neo_epoch)
Out:
NeoEpoch instance. 19 units and 27 epochs
One Neo Segment per epoch, each segment has one Neo SpikeTrain for each unit, and one Neo AnalogSignal
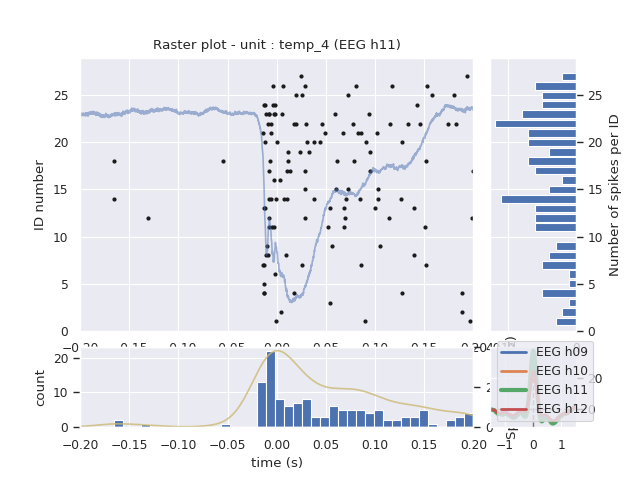
Plot the raster plot for unit 4
neo_epoch.plot_rasterplot(4)
Total running time of the script: ( 0 minutes 0.571 seconds)