Note
Click here to download the full example code
Neo All - example 1
This example shows how to use create a NeoAll instance.
Note
NeoAll instances are created from the SpykingCircus files. See here for details about these results files. NeoAll needs at least three arguments to be initiated :
- spikesorting_dirpath : the path of the directory containng the spyking circus result file
- spikesorting_filename : the name of the Spiking Circus result file
- probe_filepath : the path to the Spiking Circus probe file
For instance, the Spyking Cirucs files may look like these :
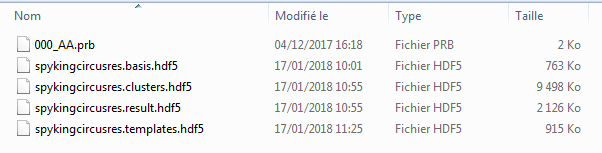
- Details of the files :
- The 000_AA.prb file is the probe file, it contains information about how contacts are organized on the electrodes, see here for more info. This file is needed for launching the spike-sorting. It is used in NeoAll for creating channel indexes and knowing the number of tetrodes.
- The .result.hdf5 file is used to store the spike times for each unit, at the end of the spike sorting procedure.
- The .template.hdf5 file contains the preffered contact of each unit.
- In order to generate the units template, three files are used : .basis.hdf5, .templates.hdf5 and .clusters.hdf5 files. Unit template is computed using the
get_templates_from_spykingcircus_file()function.
First import the neoStructures :
from neoStructures import *
import matplotlib.pyplot as plt
from os.path import isdir, join
Import the data and create the NeoAll instance
data_dir = join('pySpikeAnalysis', 'sample_data') if isdir('pySpikeAnalysis') else join('..', '..', 'pySpikeAnalysis', 'sample_data')
spykingcircus_dir = r'SpykingCircus_results'
probe_filename = r'000_AA.prb'
results_filename = r'spykingcircusres'

neoAll = NeoAll(join(data_dir, spykingcircus_dir), results_filename, join(data_dir, probe_filename), save_fig=0)
See information about NeoAll
print(neoAll)
Out:
NeoAll Instance with 54 units. 1 Neo segment per unit. Each segment contains 1 Neo spiketrain
10 channel indexes
neoAll contains a list of Neo Segments (1 segment per unit)
print(type(neoAll.segments[0]))
Out:
<class 'neo.core.segment.Segment'>
Computing the mean firing rate is easy, e.g. for unit 3:
mean_spkrate_3 = len(neoAll.segments[3].spiketrains[0]) / (neoAll.segments[3].t_stop - neoAll.segments[3].t_start)
print(mean_spkrate_3)
Out:
2.410294521750985 1/s
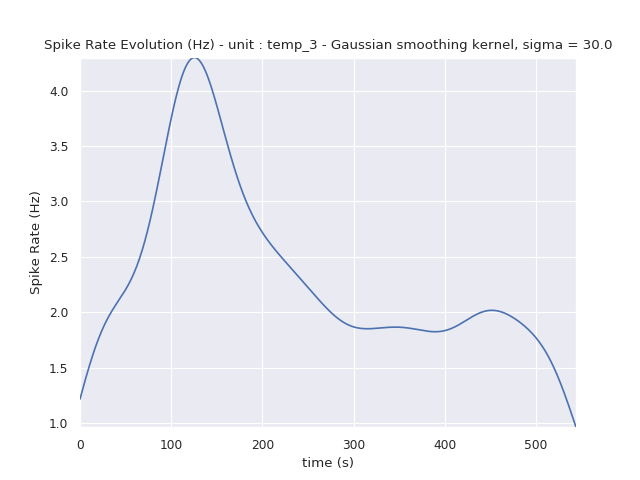
The method neoStructures.NeoAll.plot_spikerate_evolution() can be used to visualize the firing-rate over time
The firing rate is computed by kernel convolution. The kernel is gaussian and the standard deviation can be set using
the sigma_gauss_kernel parameter.
The package Elephant is used for the estimation.
neoAll.plot_spikerate_evolution(unit_pos=3, sigma_gauss_kernel=30*s)
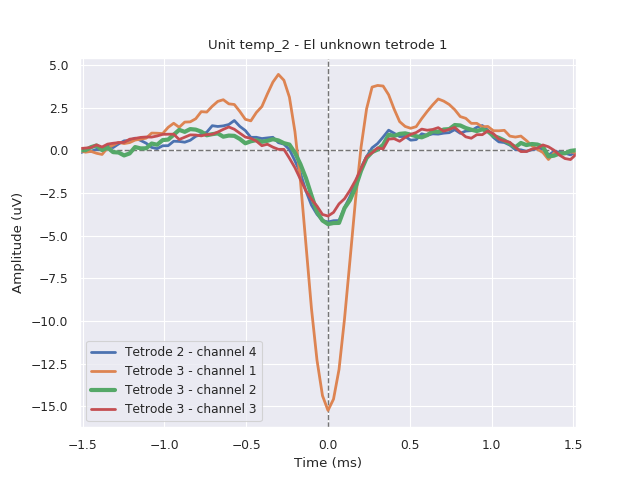
The shape of each unit can be plotted using the plot_unit_shape method :
neoAll.plot_unit_shape(2)
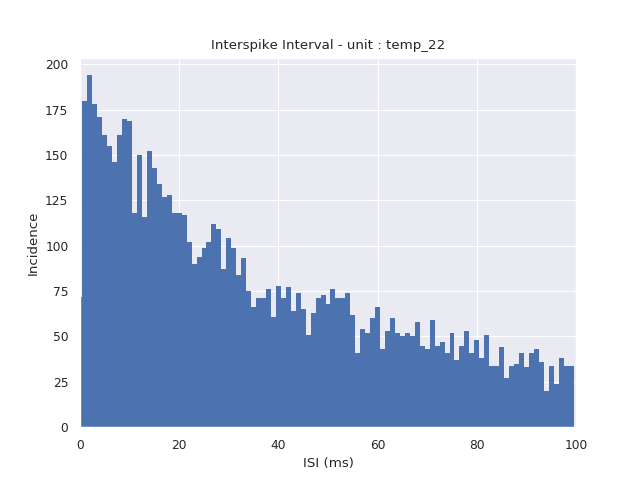
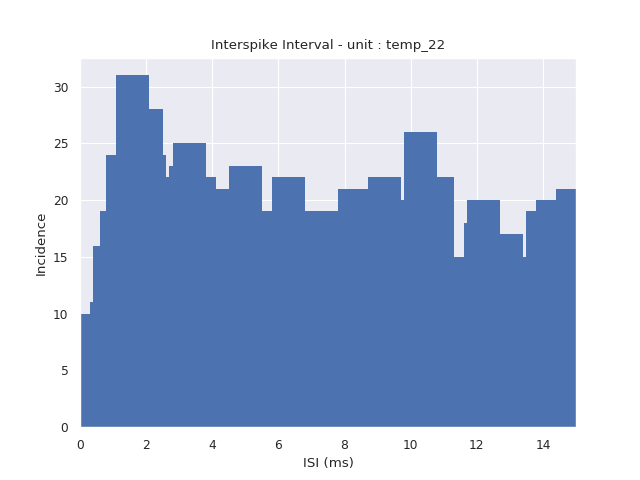
As well as the ISI (Inter-Spike Interval), e.g. for unit 22 :
neoAll.plot_isi(unit_pos=22)
Zoom on the x-origin and increase the number of bins for the histogram
neoAll.plot_isi(22, bin_duration_ms=0.1, tmax_ms=15)
Total running time of the script: ( 0 minutes 0.740 seconds)